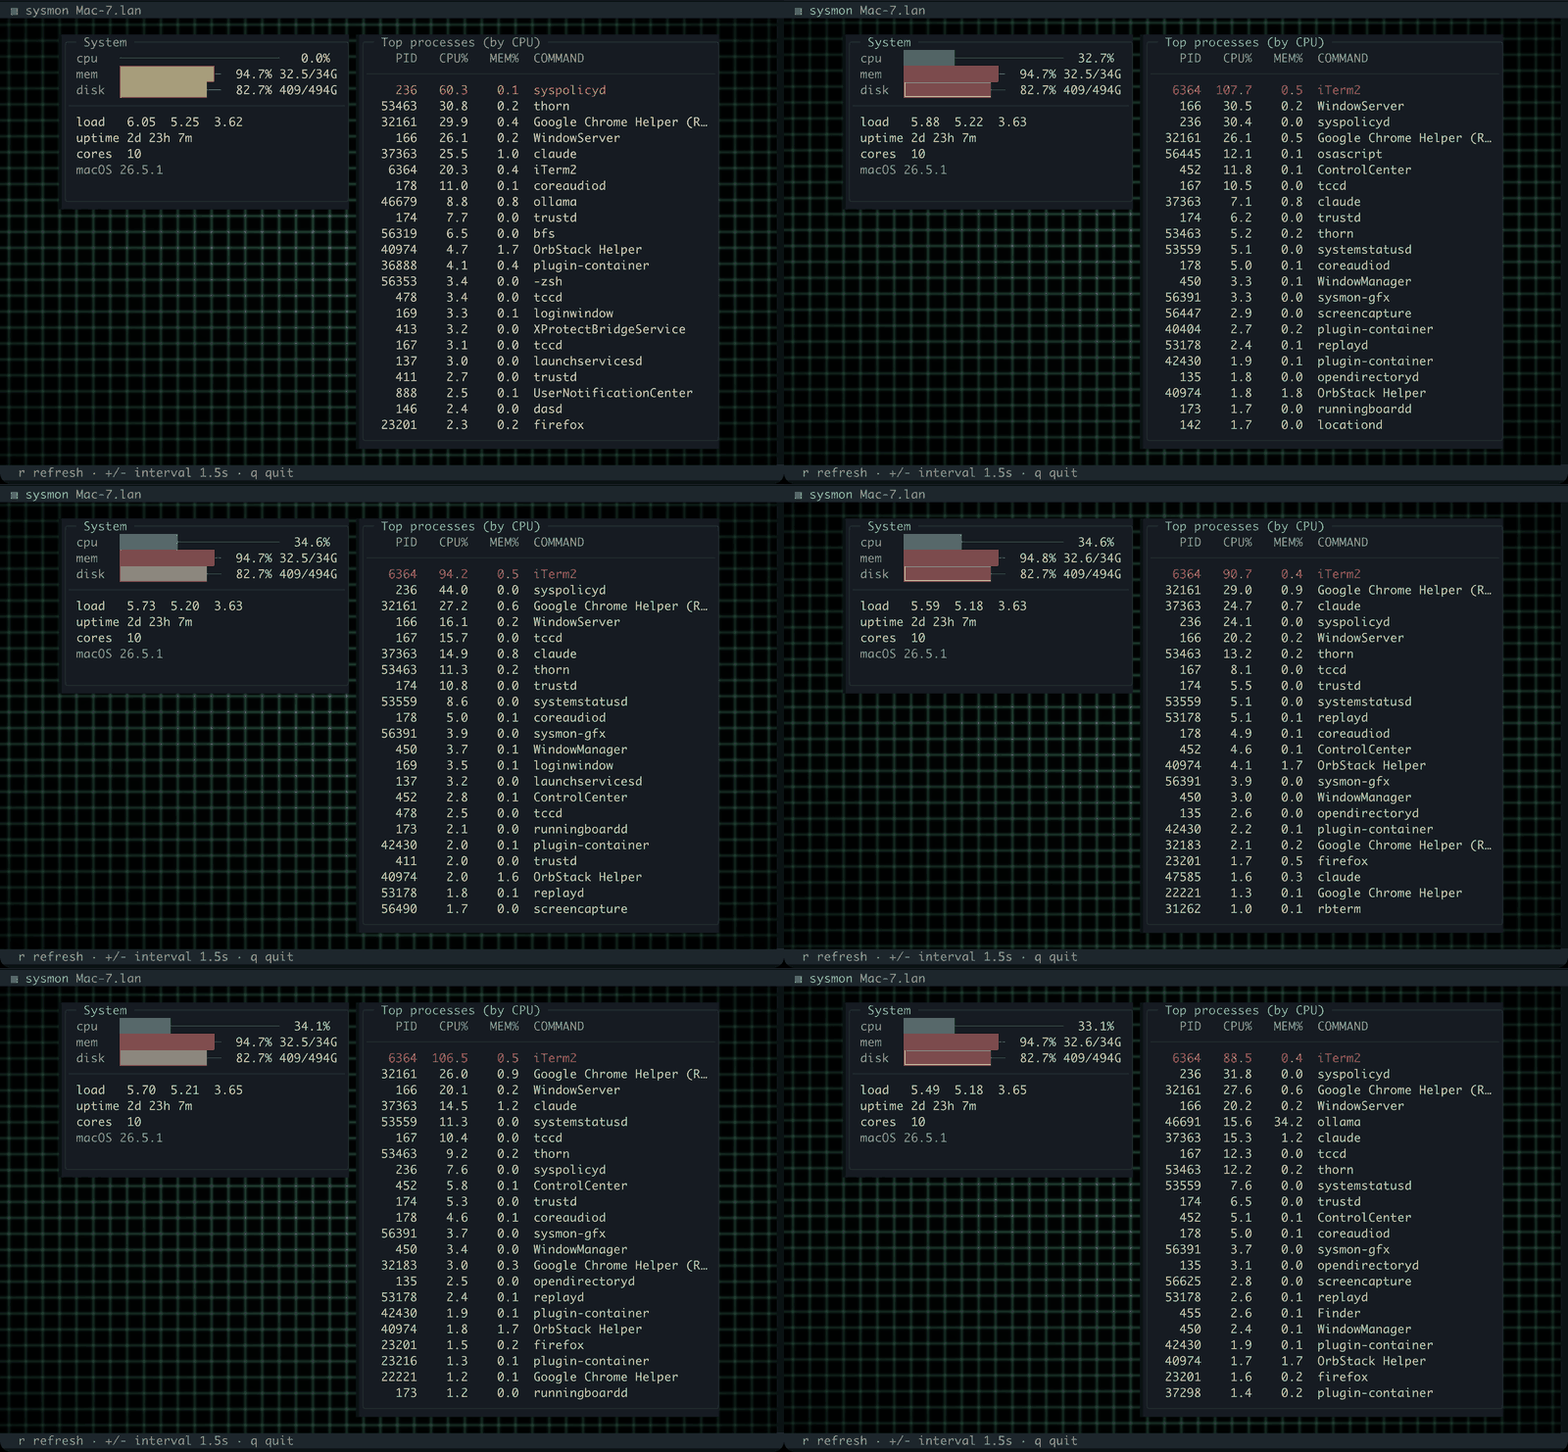
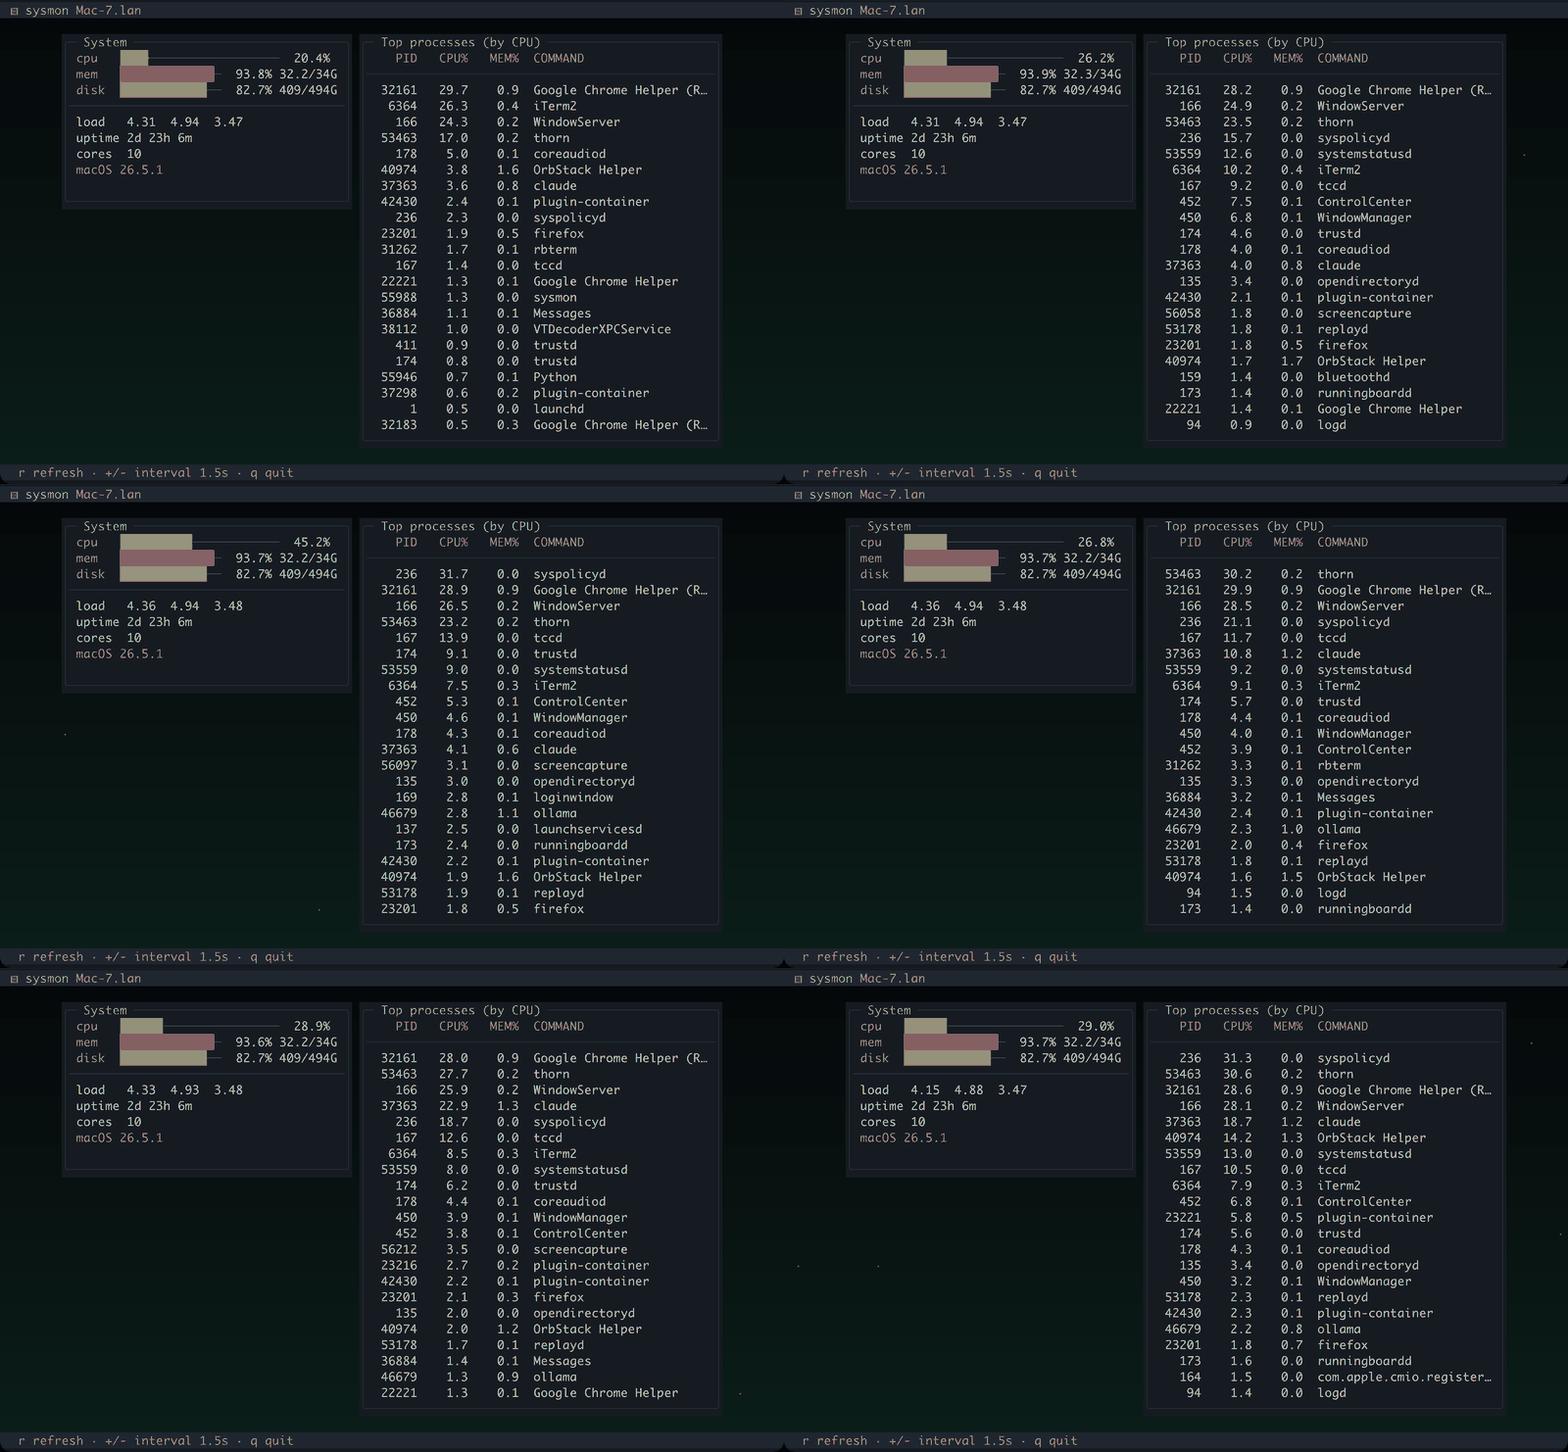
Both captures below are real iTerm2 sessions running the app — the UI is always crisp termpaint cells, and on terminals that speak the kitty graphics protocol the panels float over an animated pixel backdrop (cells everywhere else).
kitty graphics — sysmon-gfx
The gauge and process panels float over a dark, scrolling neon grid; the wallpaper animates around the panels while the live numbers update each refresh.
sysmon — kitty pixel backdrop
ASCII cells — sysmon
Threshold-coloured gauge bars (green → amber → red) for CPU / memory / disk, plus load average, uptime, core count and a ranked process table, over a quiet gradient. Stats come from mach/sysctl on macOS.
sysmon — ASCII cell mode
Controls
Key
Action
r
refresh now
+ / -
refresh interval
q / Esc
quit
Tuning env vars use the SYSMON_* prefix. SYSMON_INTERVAL sets seconds between refreshes (default 1.5); SYSMON_CELLS=1 forces cell rendering. See the overview for the full tuning table.